
Lextrus Real Estate · September 2026 · Source: Department of Lands and Surveys comparative sales data
1. At a glance
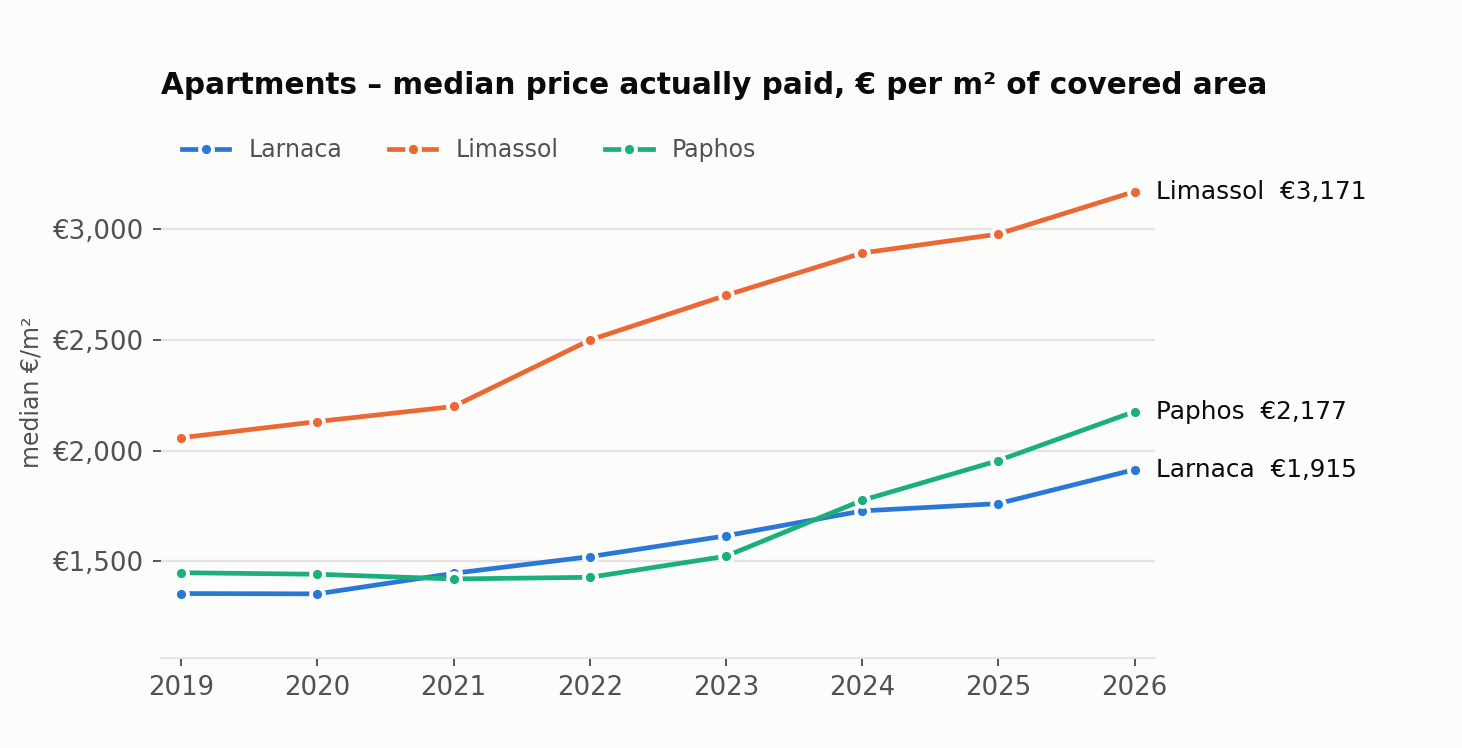
- Apartments, median 2025–26: Limassol €3,061/m² · Paphos €2,037/m² · Larnaca €1,808/m².
- From 2019 to 2025 median apartment prices rose +45% in Limassol, +35% in Paphos and +30% in Larnaca.
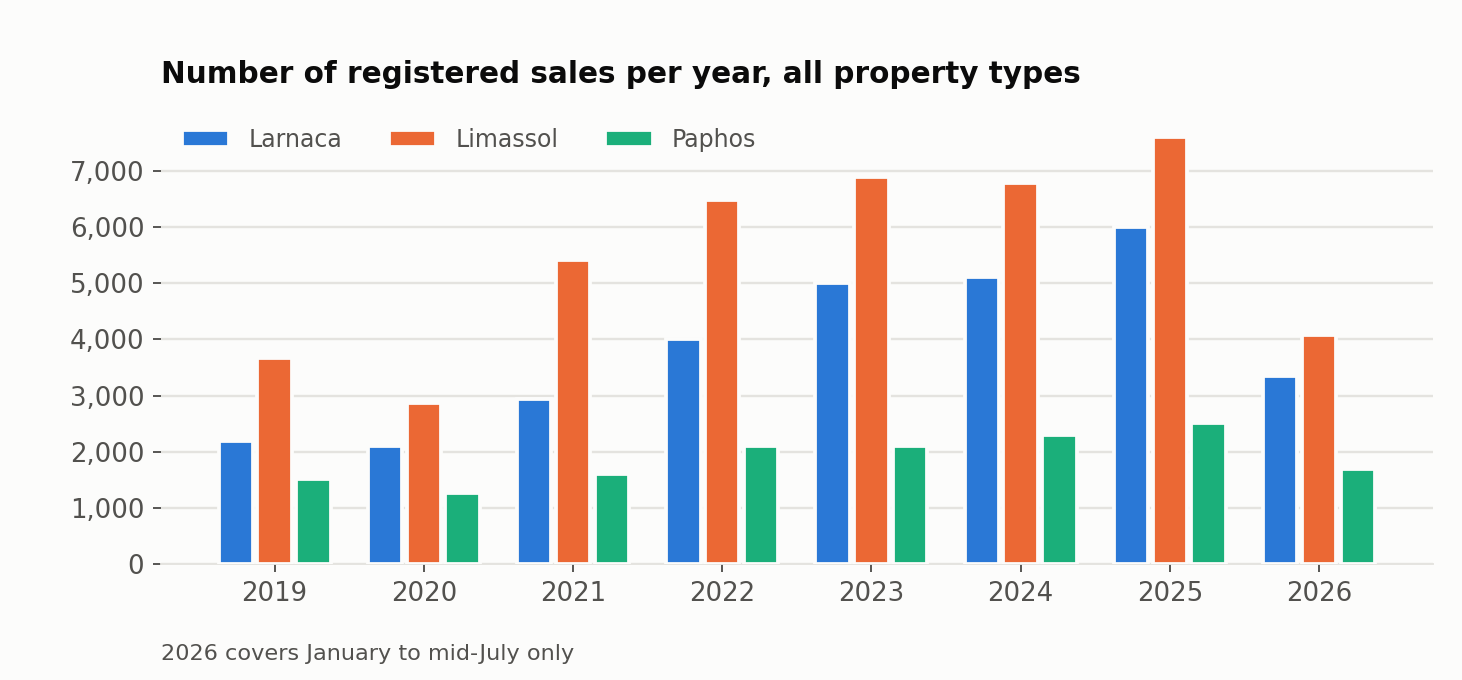
- Activity almost doubled: 7,376 registered sales across the three districts in 2019, 16,118 in 2025.
2. How this was put together
We used the Land Registry's comparative sales data: completed transfers (with the accepted price) and deposited contracts of sale (with the contract amount). Every price was divided by the covered area for apartments and houses, and by the parcel area for land, with part shares taken into account. Building plots and fields were measured separately. Commercial property is excluded.
We quote the median — the middle sale — rather than the average, so that a handful of very expensive or very cheap deals cannot distort the picture. Where we give a “usual range”, that is the band the middle half of sales falls into (25th to 75th percentile).
3. Apartments
| District | 2019 | 2021 | 2023 | 2025 | 2026* | Change 2019→2025 | Usual range 2025–26 | Sales 2019–2026 |
|---|---|---|---|---|---|---|---|---|
| Larnaca | €1.355 | €1.447 | €1.616 | €1.761 | €1.915 | +30% | €1.519 – €2.185 | 6.175 |
| Limassol | €2.059 | €2.200 | €2.702 | €2.979 | €3.171 | +45% | €2.391 – €3.947 | 5.349 |
| Paphos | €1.449 | €1.421 | €1.524 | €1.956 | €2.177 | +35% | €1.687 – €2.400 | 2.374 |
*2026 covers January to mid-July.
Limassol remains comfortably the most expensive market and the only one above €3,000/m². Paphos was flat until 2022 and has climbed quickly since, overtaking Larnaca in 2024. Larnaca has risen steadily but more gently.
4. Houses
| District | 2019 | 2021 | 2023 | 2025 | 2026* | Change 2019→2025 | Usual range 2025–26 | Sales 2019–2026 |
|---|---|---|---|---|---|---|---|---|
| Larnaca | €1.419 | €1.460 | €1.652 | €1.784 | €1.866 | +26% | €1.436 – €2.372 | 1.055 |
| Limassol | €2.049 | €2.024 | €2.424 | €2.544 | €3.238 | +24% | €2.049 – €4.098 | 1.005 |
| Paphos | €1.746 | €1.739 | €1.902 | €2.292 | €2.500 | +31% | €1.860 – €2.917 | 2.931 |
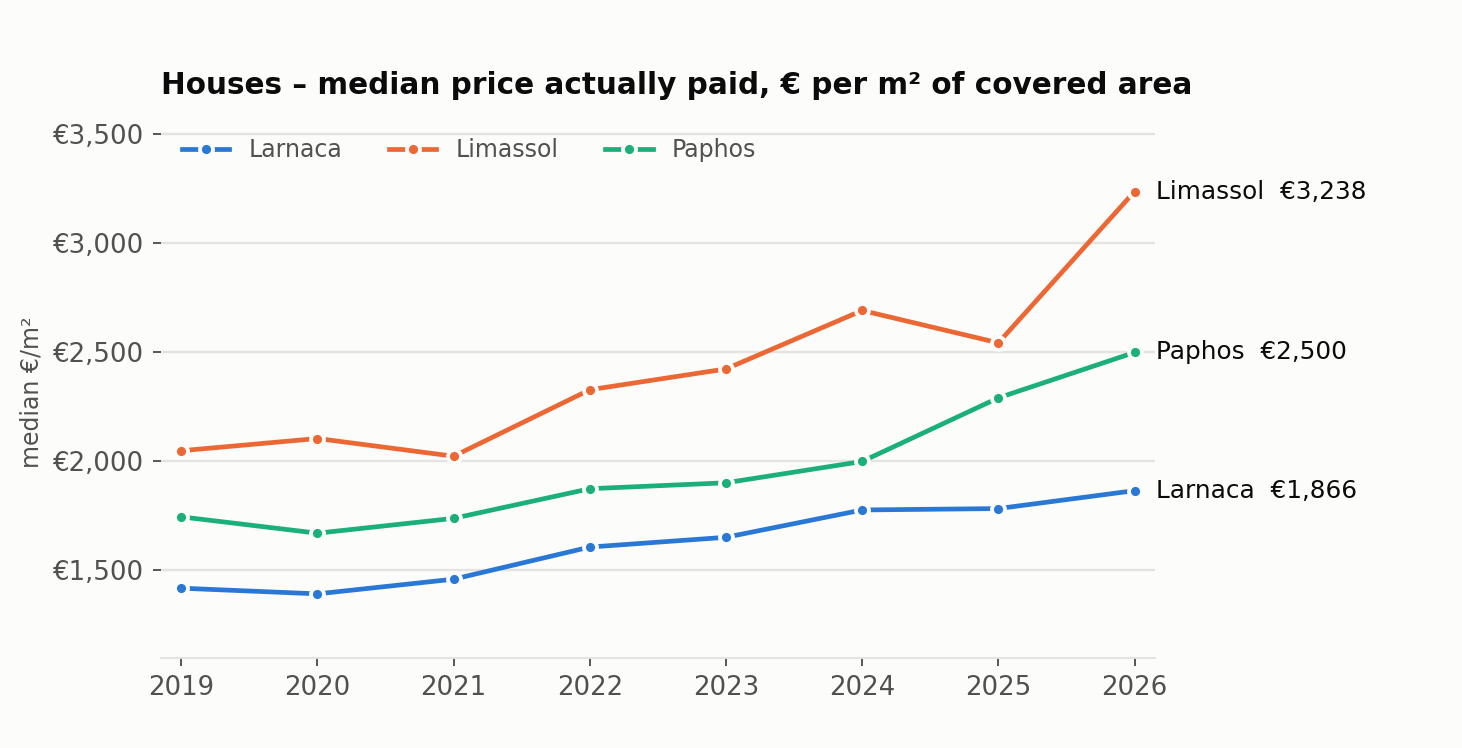
Houses vary far more than apartments, because plot size, view and condition weigh much more heavily. That is why the usual range is wide — and why an area median can never replace a proper valuation of a particular house.
5. Building plots and land
| District | 2019 | 2021 | 2023 | 2025 | 2026* | Change 2019→2025 | Usual range 2025–26 | Sales 2019–2026 |
|---|---|---|---|---|---|---|---|---|
| Larnaca | €290 | €241 | €329 | €317 | €339 | +9% | €221 – €497 | 12.096 |
| Limassol | €489 | €392 | €487 | €507 | €579 | +4% | €319 – €851 | 14.623 |
| Paphos | €314 | €283 | €298 | €273 | €246 | -13% | €157 – €582 | 2.273 |
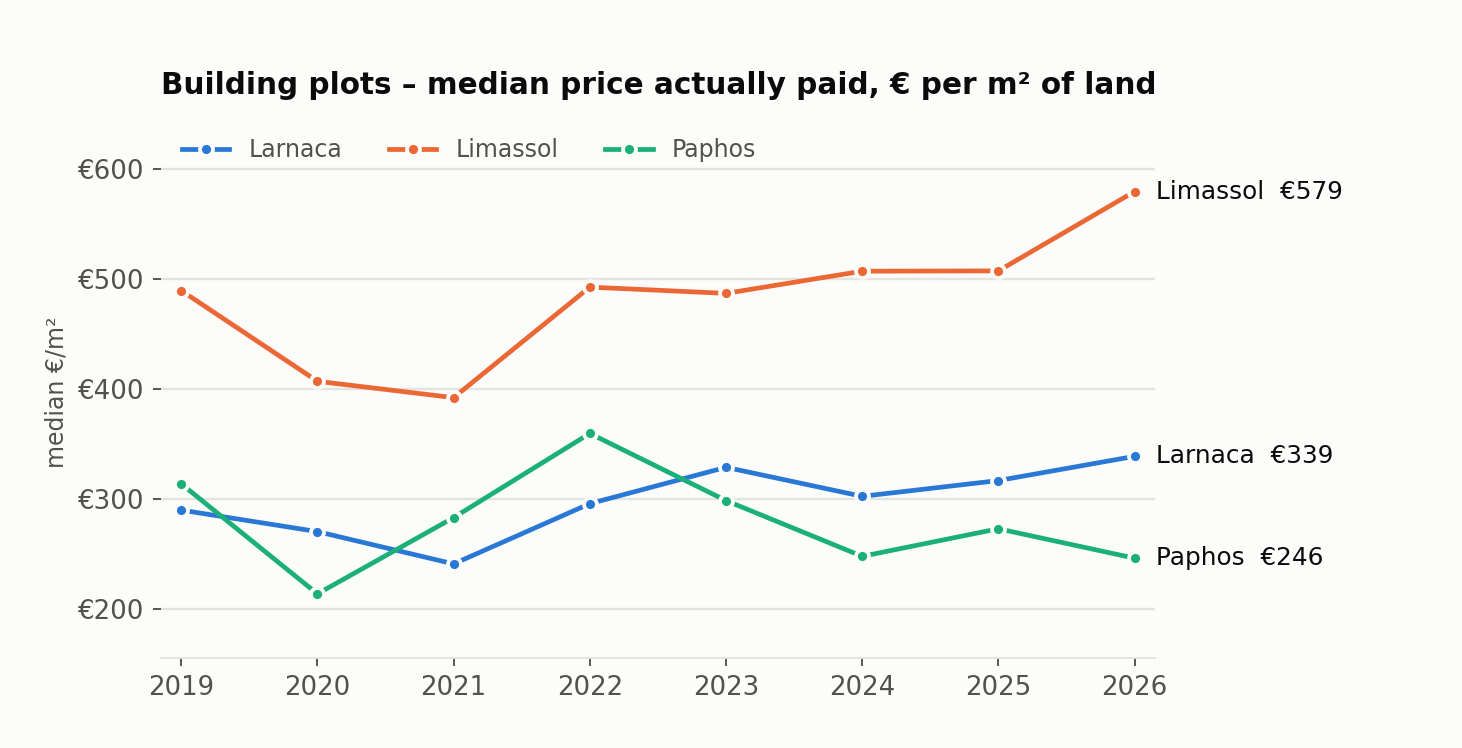
Fields are a different market altogether: the middle half of 2025–26 field sales ran at €14–€108/m² in Larnaca, €13–€159/m² in Limassol and €9–€126/m² in Paphos. Comparing a field with a building plot is the most common mistake in a rough land valuation.
6. Where prices rose the most
Median price in 2021–22 against 2025–26, for areas with enough sales in both periods.
| District | Area | Type | 2021–22 | 2025–26 | Change |
|---|---|---|---|---|---|
| Limassol | Agia Zoni | Apartments | €1.716 | €3.484 | +103% |
| Limassol | Agios Tychon | Houses | €2.419 | €3.932 | +63% |
| Limassol | Agios Ioannis | Apartments | €1.552 | €2.466 | +59% |
| Limassol | Germasogeia | Apartments | €2.632 | €4.107 | +56% |
| Paphos | Pegeia | Apartments | €1.351 | €2.107 | +56% |
| Paphos | Kouklia | Apartments | €2.812 | €4.203 | +49% |
| Paphos | Tsada | Houses | €1.620 | €2.390 | +48% |
| Limassol | Agia Fyla | Apartments | €2.296 | €3.251 | +42% |
| Limassol | Germasogeia | Houses | €2.629 | €3.721 | +42% |
| Paphos | Mandria | Apartments | €1.376 | €1.947 | +42% |
| Larnaca | Mazotos | Apartments | €1.081 | €1.523 | +41% |
| Larnaca | Pervolia | Apartments | €1.267 | €1.782 | +41% |
The fastest-rising areas are usually the ones where new developments were completed: part of the change is a shift in the quality of what changed hands, not only the price of the same property.
7. How busy the market is
| District | 2019 | 2020 | 2021 | 2022 | 2023 | 2024 | 2025 | 2026* |
|---|---|---|---|---|---|---|---|---|
| Larnaca | 2.185 | 2.104 | 2.938 | 4.002 | 4.998 | 5.115 | 6.007 | 3.352 |
| Limassol | 3.678 | 2.873 | 5.406 | 6.477 | 6.888 | 6.788 | 7.599 | 4.083 |
| Paphos | 1.513 | 1.262 | 1.606 | 2.101 | 2.098 | 2.296 | 2.512 | 1.693 |
*2026 covers January to mid-July.
In several segments the volume moved further than the price. Larnaca building plots are the clearest case: sales quadrupled since 2019 while the median price per m² rose only +9% — a busier market rather than a dearer one.
8. What the numbers mean in practice
- If you are selling: asking prices sit well above the figure that ends up in the contract. What matters is not whether you are above your area's median — it is whether you are above the top of its range without a good reason for it.
- If you are buying: ask for the real sales in that specific area and property type, not a district average. A village and the town next to it are separate markets.
- Either way: compare like with like — same type, same area, similar size.
9. Method and limits
- Transfers are registered months, sometimes years, after the price was agreed — off-plan sales especially. Every year therefore mixes in older agreements: read the direction of travel rather than a single year.
- The Land Registry records no floor, condition, view, finish or zoning. An area median is evidence, not a valuation.
- A median is shown only where there were at least 5 sales. 2026 is a part year.
Want the figures for your own area?
Lextrus Real Estate is a licensed estate agency with a registered valuer. We can pull the real sales for your property and your street.
Contact the officeFigures as at September 2026. Published for information; it is not a valuation or investment advice.